
티스토리 뷰
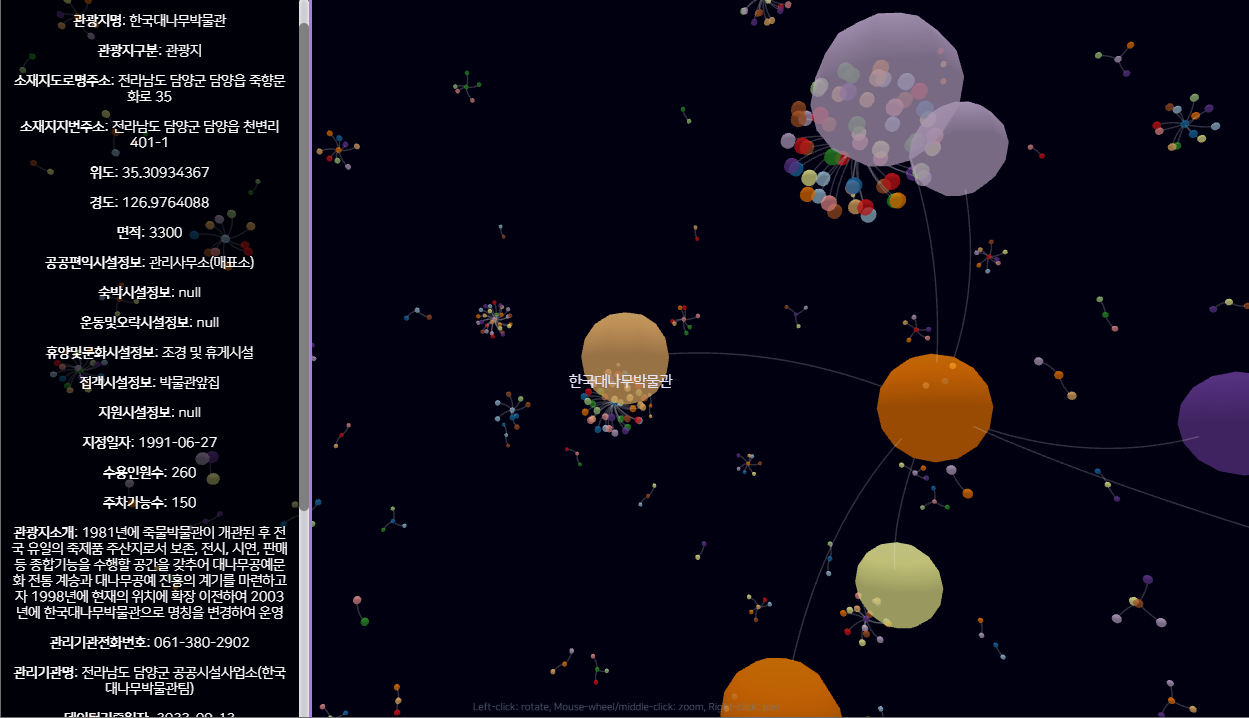
- 3D Force Graph를 이용한 시각화 예제
- 3D Force Graph는 3D 공간에 노드와 링크를 표현하는 시각화 라이브러리이고, 원본 깃헙에 예제가 다양하게 존재함
- CSV 파일을 읽어와서 3D Force Graph에 사용하는 JSON으로 변환하는 코드 포함
- 노드를 클릭하면 해당 관광지의 정보를 보여주는 infoBox 구현
- 사용 데이터: 전국관광지정보표준데이터
모든 코드는 Github 레포지토리에 공개되어있습니다
데이터 정제
import pandas as pd
import numpy as np
import json

df = pd.read_csv('data.csv', encoding='cp949') # 공공데이터는 주로 cp949로 인코딩 되어있음
# null값 처리
df = df.replace({np.nan: None})
df = df.replace({'  ': " "})
df.head()

# 관광지 식별을 위한 id 컬럼 추가
df['id'] = "tour" + df.index.astype(str)
# 관광지 id를 index로 설정
df.set_index('id', inplace=True)
# node와 link 관계 생성을 위해 dict 형태로 데이터 가공
df_dict = df.to_dict(orient='index')

# json 데이터 생성
graph_json = {"nodes": [], "links": []}

for index, item in df_dict.items():
    # 모든 컬럼 정보를 node의 속성으로 추가
    node = {"id": str(index)}
    for column, value in item.items():
        node[column] = value
    graph_json["nodes"].append(node)

    # link 관계를 위한 target 설정
    link_targets = [
        item['제공기관코드']
    ]

    for target in link_targets:
        if target is not None:
            graph_json["links"].append({"source": str(index), "target": str(target)})
            # target도 node로 추가
            # target이 이미 추가되었는지 확인
            if not any(d['id'] == str(target) for d in graph_json["nodes"]):
                graph_json["nodes"].append({"id": str(target), "name": item['제공기관명']})

 print("nodes의 총 개수: ", len(graph_json["nodes"]))
 print("links의 총 개수: ", len(graph_json["links"]))

 # graph_json를 json 파일로 저장
with open(f'data.json', 'w') as outfile:
    json.dump(graph_json, outfile, ensure_ascii=False, indent=4)
index.html
<!--head, style 생략-->

<body>
  <div id="3d-graph"></div>
  <div id="infoBox">노드에 대한 정보가 표시됩니다</div>
</body>
<script>
  const elem = document.getElementById("3d-graph");
  let infoBoxElement = document.getElementById("infoBox");

  const Graph = ForceGraph3D()(elem)
    .jsonUrl("data/data.json") // data.json 파일을 불러옴
    .nodeAutoColorBy("id") // id를 기준으로 랜덤 색상 지정
    .nodeRelSize(6) // 노드 크기
    .linkCurvature(0.2) // 곡률
    .nodeLabel((node) => {
      if (node.관광지명) {
        return `${node.관광지명}`;
      } else {
        return node.name; // 제공기관 노드의 경우 name 표시
      }
    })
    .onNodeClick((node) => {
      // 클릭 시 infoBox에 정보 표시
      createInfoBox(node);
      // Aim at node from outside it
      const distance = 100;
      const distRatio = 1 + distance / Math.hypot(node.x, node.y, node.z);

      const newPos =
        node.x || node.y || node.z
          ? {
              x: node.x * distRatio,
              y: node.y * distRatio,
              z: node.z * distRatio,
            }
          : { x: 0, y: 0, z: distance }; // special case if node is in (0,0,0)

      Graph.cameraPosition(
        newPos, // new position
        node, // lookAt ({ x, y, z })
        3000 // ms transition duration
      );
    });

  // 클릭 시 infoBox에 정보 표시하는 함수
  function createInfoBox(node) {
    console.log("node", node);
    if (infoBoxElement !== null) {
      infoBoxElement.innerHTML = ""; // Clear existing content
      // infoBox 초기화
      // node의 모든 key와 value를 p 태그로 표시
      Object.keys(node).forEach((key) => {
        let p = `<p><b>${key}</b>: ${node[key]}</p>`;
        infoBoxElement.innerHTML += p;
      });
    }
  }
</script>
반응형
'개발일지' 카테고리의 다른 글
| Node.js 기초 (0) | 2024.06.24 |
|---|---|
| [Ubuntu] 우분투 서버(ubuntu server) 글자 크기 CLI로 변경 (0) | 2024.02.05 |
| [postgreSQL] 원격으로 shp 파일 넣기 (0) | 2023.10.18 |
| [postgreSQL] 모든 테이블의 행 수(row), 열 수(column) 조회하기 (0) | 2023.09.20 |
| [linux] 사용자 추가, 비밀번호 변경, 홈 디렉터리 변경 (0) | 2023.09.18 |
반응형
공지사항
최근에 올라온 글
최근에 달린 댓글
- Total
- Today
- Yesterday
링크
TAG
- Encoding
- ChatGPT
- rdffox
- Claude
- 키워드추출
- SPARQL
- Vue3
- hadoop
- pdfmathtranslate
- 지식그래프
- 지식그래프임베딩
- TextRank
- polars
- geospy
- PEFT
- writerow
- LLM
- pandas
- cursorai
- vscode
- knowledgegraph
- PostgreSQL
- python
- Postgis
- rdflib
- python'
- psycopg
- deepseek
- MongoDB
- vervel
| 일 | 월 | 화 | 수 | 목 | 금 | 토 |
|---|---|---|---|---|---|---|
| 1 | ||||||
| 2 | 3 | 4 | 5 | 6 | 7 | 8 |
| 9 | 10 | 11 | 12 | 13 | 14 | 15 |
| 16 | 17 | 18 | 19 | 20 | 21 | 22 |
| 23 | 24 | 25 | 26 | 27 | 28 |
글 보관함